Member-only story
Exploring Market Interconnections with Network Theory in Finance
Delve into the intricate world of market dynamics using the formidable tool of Network Theory, a concept extending its reach into the realm of finance. In this tutorial, we embark on a journey through Python to harness the power of Network Theory, unraveling the intricate web of connections that exist within financial markets. By dissecting the relationships between various financial assets, we unlock a trove of valuable insights that can illuminate market trends, unearth opportunities and unveil potential risks.
Navigating the Financial Landscape
To begin our exploration, we will first gather real financial data for a diverse set of securities. We will use the yfinance library to download historical price data for these assets. Let's start by importing the necessary libraries and downloading the data.
import yfinance as yf

# Define a list of securities to download data for
securities = ['GOOGL', 'TSLA', 'NFLX', 'AMZN', 'BTC-USD']

# Download historical price data for the securities
data = yf.download(securities, start='2020-01-01', end='2024-02-29')
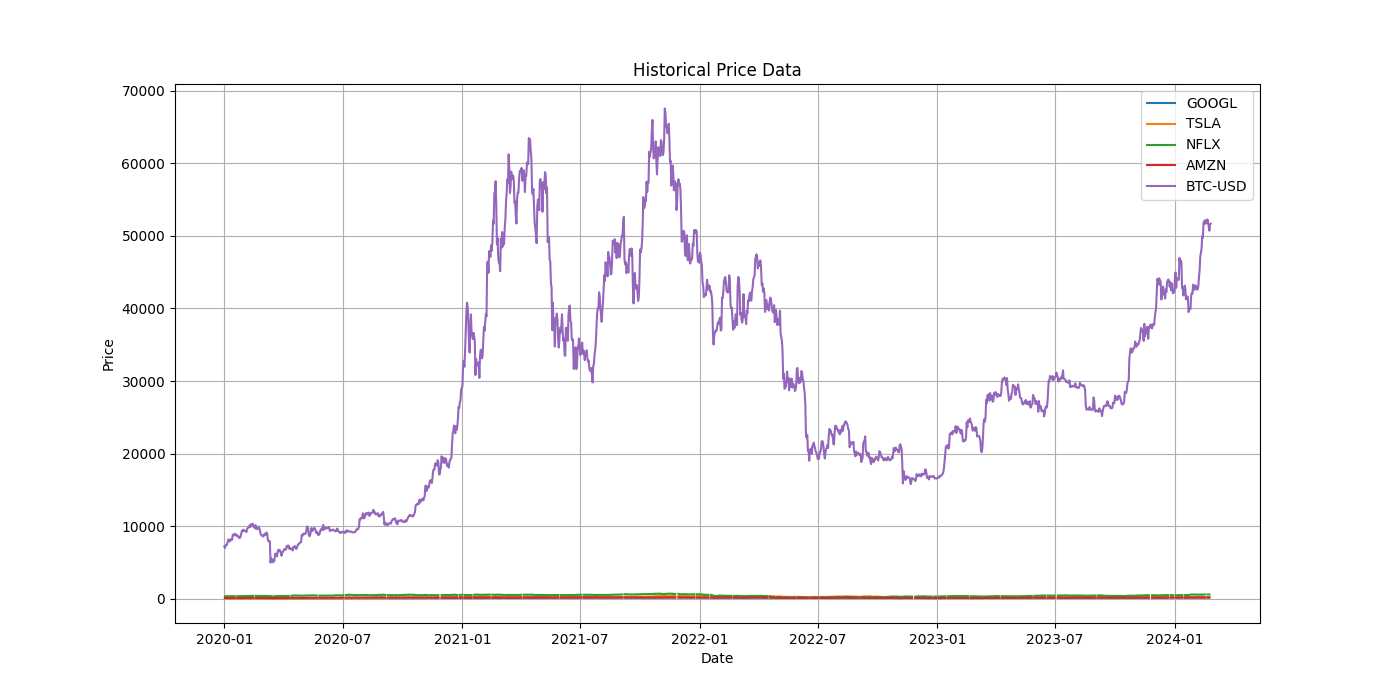
Now that we have obtained the data, let’s visualize the price movements of these assets over time. We will create a plot to display the closing prices of each security on the same chart.
import matplotlib.pyplot as plt

plt.figure(figsize=(14, 7))
for security in securities:
    plt.plot(data['Close'][security], label=security)

plt.title('Historical Price Data')
plt.xlabel('Date')
plt.ylabel('Price')
plt.legend()
plt.grid(True)
The plot above shows the historical price data for the selected securities. We can observe the price movements of each asset over time and identify any trends or patterns that may exist.
Construct Network
Next, we will construct a network to represent the interconnections between these assets. Each security will be represented as a node in the network and the relationships between them will be represented as edges. To create the network, we will calculate the…
